In 2010, Labrigger wrote about how to measure the gain of a imaging system. As mentioned there in the comments, this was discussed in more detail by James Pawley in the confocal microscopy mailing list quite recently (following a question I asked to the list), and I was motivated to try this out myself for my (2P point scanning) system.
Briefly, as described in more detail by Labrigger, you take the mean and the variance of the image, divide one by the other and get the gain (i.e. one detected photon translates into an increase of how many pixel values). This value should not be lower than 1. This gain then allows to calculate the number of photons that arrive at a single pixel.
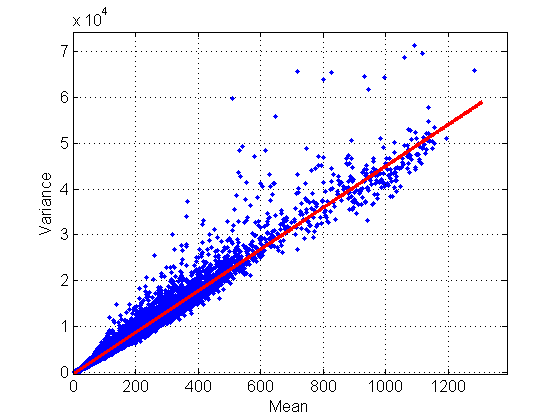
Instead of using a homogeneous frame as proposed by Labrigger, I used a simple rhod-2 injected brain sample, but I calculated mean and variance of a pixel not spatially over the image, but temporally within each pixel, thus having a) a realistic sample and b) more statistics. Plotting variance against mean allows to fit a straight line, the slope of which gives you the gain.

Fitting var/mean for all pixels of a 512×512 image with a resulting gain ~ 45. System: A standard Hamamatsu PMT, a Femto DHCP preamp, and an Alazar ATS-9440 DAQ board with the input range set to 0.2 V (0.2 V translating into 13 bit).
The calculated gain (ca. 45) is fine … although the real gain might be lower due to multiplicative noise that undermines the assumption of Poisson noise (for a discussion see the above-mentioned post by James Pawley). Additionally, this is a living sample, with moving fluorophors adding to variability in time. Still, I like the idea of using a simple movie of a sample as I use it all day.
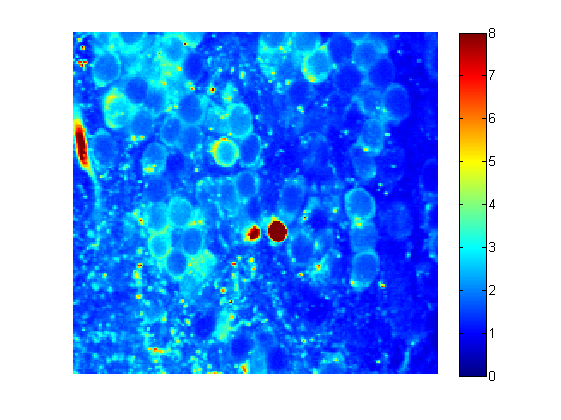
The gain then allows to calculate the number of photons per pixel (see again Labrigger’s post for more details). Here it is:

Estimate of numbers of photons per pixel; excerpt of the 512×512 image series used for generating the above plot. The bright (red) spots are blood vessels and not of interest.
Looks like I’m getting around 2-6 photons per pixel for cytoplasm (rhod-2 staining). I was sampling at 80 MHz and binning pixels 8x (4096 sampling points per line to 512 pixels). For real experiments, I want to go to larger images, with binning reduced to 2x, at hte same time reducing the number of photons per pixel to less than 3. – But there would still be room left to increase the laser power and therefore the photon yield. Additionally, as mentioned above, I possibly overestimated the gain by factor which might be even as big as 2, which would increase the real number of detected photons per pixel by the same amount. In the end, this does not really matter, if the real data look bad/nice anyway; but it’s nice to count in physical numbers.

Pingback: Preamplifier bandwidth & two ways of counting photons | A blog about neurophysiology